Trading decisions are rarely made without support from tools and data. Successful traders rely on a set of core tools and indicators to analyze price movements, manage risk, and execute trades efficiently. While tools do not guarantee profits, understanding how and when to use them improves structure, consistency, and decision quality.
Trading Platforms and Charting Software
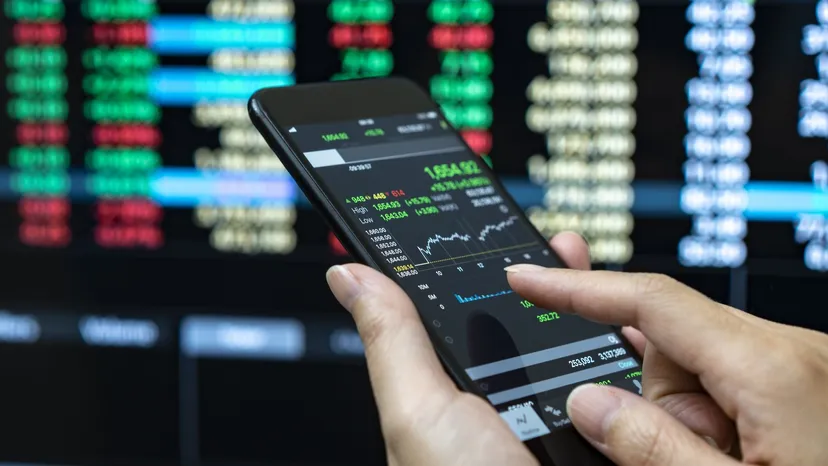
A trading platform is the primary interface through which traders access markets, analyze charts, and place trades. Reliable platforms provide real-time price data, order execution, and account management features. Charting software is integrated into most platforms and allows traders to visualize price movements across different time frames.
Charts help identify trends, support and resistance levels, and potential trade setups. Common chart types include line charts, bar charts, and candlestick charts. Candlestick charts are widely used because they clearly display price action and market sentiment within specific time intervals.
Order Types and Execution Tools
Understanding order types is essential for controlling execution and risk. Market orders execute immediately at the current price, while limit orders allow traders to specify the price at which they want to buy or sell. Stop orders are used to limit losses or enter trades once a certain price level is reached.
Execution tools help manage trades efficiently and reduce emotional interference. Predefined stop-loss and take-profit orders ensure that exits are planned in advance, which supports discipline and risk control.
Moving Averages
Moving averages are among the most commonly used technical indicators. They smooth price data over a specified period to help identify trends. Simple moving averages and exponential moving averages are the most widely used types.
Moving averages can indicate trend direction and potential support or resistance levels. Crossovers between short-term and long-term moving averages are often used to identify changes in momentum. While moving averages are lagging indicators, they provide clarity in trending markets.
Support and Resistance Levels
Support and resistance are key price levels where buying or selling pressure tends to increase. Support levels are areas where prices historically stop falling and begin to rise, while resistance levels are areas where prices struggle to move higher.
Identifying these levels helps traders plan entries, exits, and stop placements. Support and resistance are not exact points but zones where market reactions are likely to occur. These levels are foundational tools in technical analysis.
Momentum Indicators
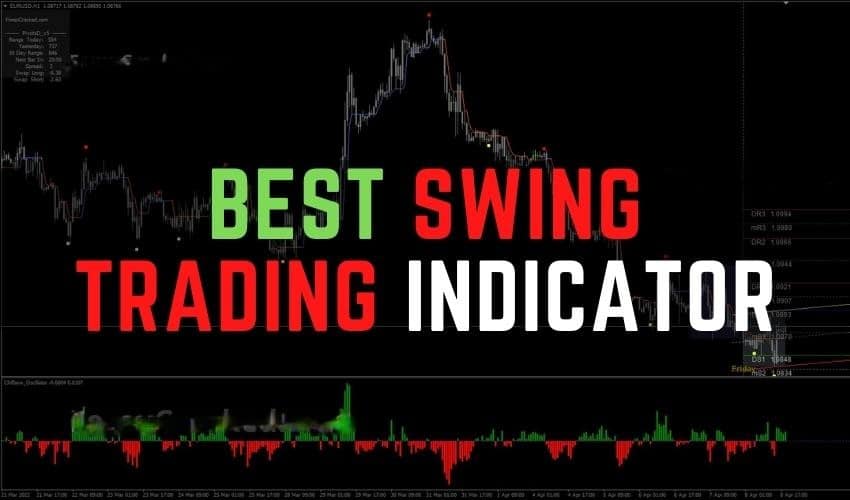
Momentum indicators measure the speed and strength of price movements. Common examples include the relative strength index and moving average convergence divergence. These indicators help identify overbought or oversold conditions and potential trend reversals.
Momentum indicators are particularly useful in ranging markets or when confirming trend strength. However, they should not be used in isolation, as signals can be misleading during strong trends.
Volume Analysis
Volume represents the number of units traded over a given period. Volume analysis provides insight into the strength of price movements. Rising prices accompanied by increasing volume often indicate strong buying interest, while declining volume may signal weakening momentum.
Volume can also confirm breakouts and trend continuations. Low-volume price movements are generally less reliable and more prone to reversal.
Risk Management Tools
Risk management tools are essential for long-term trading survival. Position sizing calculators help determine how much capital to allocate to each trade based on risk tolerance. Stop-loss orders limit potential losses and protect capital.
Risk management tools ensure that no single trade can cause significant damage. Consistent application of these tools often matters more than the specific indicators used.
Using Indicators Effectively
Indicators should support decision-making, not replace it. Overloading charts with too many indicators creates confusion and conflicting signals. Effective traders use a small number of tools they understand well.
Combining indicators that measure different aspects of market behavior improves reliability. For example, trend indicators can be combined with momentum or volume tools for confirmation.
Common Mistakes With Trading Tools
A common mistake is relying on indicators as prediction tools rather than confirmation tools. Another is constantly changing indicators in search of perfect signals. Tools work best when used consistently within a defined strategy.
Understanding the limitations of indicators prevents unrealistic expectations.
Conclusion
Trading tools and indicators provide structure, clarity, and discipline to trading decisions. From charting platforms and order types to moving averages, support and resistance, and risk management tools, each serves a specific purpose. When used thoughtfully and consistently, these tools support better analysis and more controlled execution. Trading success depends not on the number of tools used, but on how well they are understood and applied.